
Managing Diseases in a Rainy Year
Gabriel Torres, UCCE Tulare & Kings Counties, from Vit Tips December 2019
The climate in California is described as Mediterranean. This means that our summers are dry and hot, while winters are mild and wet. However, the weather in 2019 did not behave as expected. With cool temperatures in February, a drier than normal April, and an unusually cool and rainy May 2019 will be remembered as an extraordinary weather year. It is impossible to say if this would be the new normal, but it is clear, that something happened in our local weather during 2019.
| Table 1. Differences in Monthly Average High Temperatures in SJV against the annual average. | ||||||||||
|---|---|---|---|---|---|---|---|---|---|---|
| Name | CIMIS ID | JAN | FEB | MAR | APR | MAY | JUN | JUL | AUG | SEP |
| STRATFORD | 15 | 5.2 | -5.3 | -0.5 | 4.4 | -6.5 | 1.3 | -0.4 | 0.7 | -1.4 |
| FRESNO STATE | 80 | 5.9 | -5 | -0.9 | 3.3 | -7.7 | 0 | 0.1 | 0.1 | -2.1 |
| LINCOVE | 86 | 4.6 | -3.3 | 0.6 | 6.4 | -4.6 | 5.7 | 3.8 | 5 | 2.2 |
| WESTLANDS | 105 | 5.9 | -3.4 | -0.1 | 7.5 | -3.4 | 6.1 | 5 | 5.6 | 1.6 |
| ARVIN EDISON | 125 | 7.9 | -3 | -1.6 | 4.4 | -6.2 | 2.6 | -0.9 | -0.1 | -1 |
| MERCED | 148 | 6.3 | -4.8 | -0.5 | 1.8 | -6.7 | 1 | 0.8 | 0.7 | -1.2 |
| PORTERVILLE | 169 | -2.9 | -11.6 | -5.4 | 2 | -7.1 | 2.7 | 0.5 | 1.6 | -1 |
| DELANO | 182 | 5.4 | NA | -5 | 0.3 | -9.9 | -2.4 | -4.9 | -1.8 | -3.8 |
| NA- Data not available | ||||||||||
By October 1st, 2019, information collected from different CIMIS stations in the San Joaquin Valley (SJV) demonstrated that the average high monthly temperature was lower by 6 F° for February and May (Table 1 and Figure 1). This phenomenon pushed the average high temperatures in February below 60 F° delaying bud break up to two weeks. In May, the average high temperatures were below 80 F°, favoring disease outbreaks.
For precipitation, the data collected from CIMIS indicates annual rainfall was highly variable between locations. Some stations received 30% above annual precipitation, whereas others received 20% less than average. However, regardless of the annual precipitation accumulation, all the evaluated stations in the SJV saw less than normal precipitation in April (10-90%), and far more than normal precipitation in May (300% to 1400% above normal; table 2 and figure 2).
In the dry San Joaquin Valley, an above-average rainy season, especially when it brings a large snowpack, is appreciated. However, rain and dew after budbreak provide the proper conditions for a disease outbreak. When green tissue, water drops, and the proper temperature range, diseases such as botrytis, and Phomopsis can become problematic. Humid conditions can also exacerbate powdery mildew infections by promoting spore release from its overwinter structures.
Botrytis is a disease that can develop in temperatures ranging from 32 to 86 F°. However, the optimal growth is observed when temperatures range between 56 and 77 F°. Botrytis is normally observed at the beginning and at the end of the growing season. During spring and early summer, the disease is can affect all succulent tissue were free water is located (leaves, canes, inflorescences and shots), and it is commonly known as botrytis shoot blight. Between veraison and harvest, botrytis can be observed affecting ripened berries; when matured clusters are affected the disease is known as botrytis bunch rot.
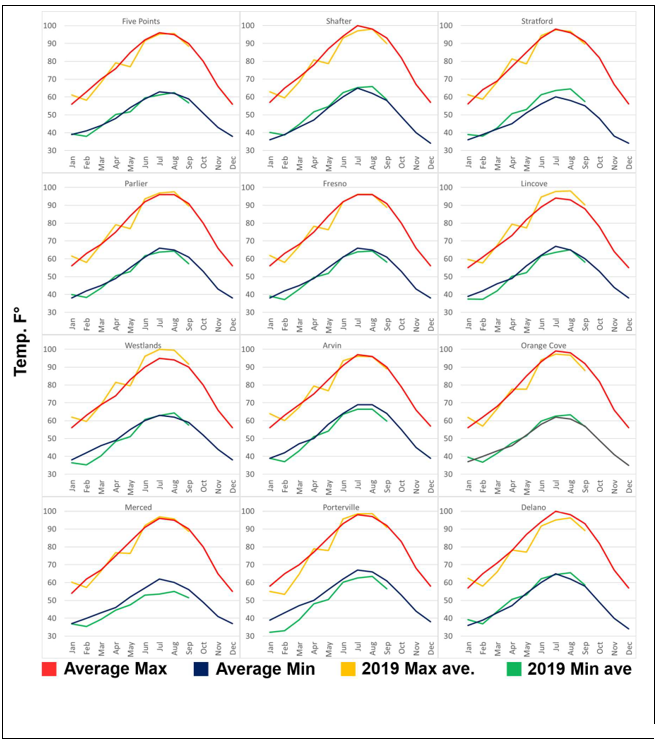
Figure 1. Comparison between 2019 January to September monthly maximum and minimum temperatures and the annual average.
For initial infection Phomopsis needs temperatures between 40 and 95 F°, with an optimal initial infection between 60 and 70 F°. Powdery mildew grows in temperatures between 50 to 95F°, with an optimal growth temperature between 73 and 86 F°. All these pathogens also require high humidity conditions for their initial germination and infection. In SJV vineyards botrytis and Phomopsis are not major problems during dry spring seasons. However, the wet and mild 2019 conditions were favorable for pathogen development. This led to the development of diseases across multiple tissue types, which can be seen in Figure 3.
These diseases can be managed through cultural practices and the judicious use of pesticides. Cultural practices start with canopy management to manage a disease under wet conditions. Improved aeration, through canopy management techniques that open the canopy, helps to reduce humidity, allows wet tissue to dry faster, and improves fungicide coverage. If the amount of rain is significant, adjust irrigation accordingly. Overirrigation, increases vineyard humidity, which can promote the development of fungal infections. Another cultural practice is to have a proper nutrition plan. Excessive use of nitrogen can result in a plant with succulent tissues that are more easily infected by pathogens.

Figure 2. Differences between 2019 precipitation and annual average
Also important is to use fungicides with wide spectrum efficacy. These products usually work as preventive and have contact activity. For these reasons, sprayer calibration is key, and the products need to be applied before infection takes place. Another important step is to determine if a fungicide spray is needed, check weather conditions periodically, and determine if the forecasted conditions are suitable for pathogen to infect your crop. If rain and the optimal temperatures described previously are forecasted, consider spray at least one day before the predicted rain event.

During normal conditions soft chemistries and multisite fungicides are sprayed every 10 days. However, if conditions are conductive for disease development, consider reduce the interval to 7 days if the label allows you to do so. When considering stylet oil as a preventive, be sure that temperatures above 90 F° won’t occur in the days after its application and that sulfur won’t be sprayed during the next 2 weeks after the oil application.
Once infection takes place, the use of synthetic fungicides is advised for non-organic growers. Follow the label instructions and remember to rotate mode of action (FRAC groups) to reduce resistance development. Under severe disease pressure, check your label to see if the interval can be reduced to 10 days. If rain is expected, use a sticker-spreader that is compatible with your selected fungicide.
Prevention is the most successful measure to manage a plant disease. Improve your defensive line by having a good irrigation and nutrition plan. Check weather forecast in a timely manner and plan sprays accordingly. Have products that you expect to use in stock and follow the label instructions. Keep your spray equipment well maintained and keep spare parts so they can be replaced when needed.
| Location | Station Id | Jan | Feb | Mar | Apr | May | Jun | Jul | Aug | Sep | Total |
|---|---|---|---|---|---|---|---|---|---|---|---|
| Stratford | 15 | 1.17 | 1.52 | 1 | 0.45 | 2.94 | 0 | 0 | 0 | 0 | 7.08 |
| Annual Ave. | 1.54 | 1.46 | 1.61 | 0.55 | 0.31 | 0.08 | 0 | 0.04 | 0.31 | 5.9 | |
| Fresno State | 80 | 2.96 | 3.63 | 1.51 | 0.49 | 2.41 | 0 | 0 | 0 | 0 | 11 |
| Annual Ave. | 2.28 | 2.01 | 2.48 | 1.02 | 0.55 | 0.24 | 0.04 | 0.04 | 0.31 | 8.97 | |
| Lincove REC | 86 | 1.73 | 3.5 | 2.54 | 0.62 | 1.92 | 0 | 0 | 0 | 0 | 10.31 |
| Annual Ave. | 1.93 | 1.85 | 2.01 | 0.94 | 0.35 | 0.16 | 0 | 0 | 0.16 | 7.4 | |
| Westlands | 105 | 0.82 | 1.43 | 0.89 | 0.34 | 1.42 | 0 | 0 | 0.01 | 0 | 4.91 |
| Annual Ave. | 1.97 | 1.93 | 1.46 | 0.67 | 0.47 | 0.08 | 0.04 | 0.04 | 0.24 | 6.9 | |
| Arvin-Edison | 125 | 0.2 | 1.01 | 1.85 | 0.08 | 2.86 | 0 | 0 | 0 | 0 | 6 |
| Annual Ave. | 1.14 | 1.22 | 1.22 | 0.51 | 0.2 | 0.08 | 0 | 0.04 | 0.08 | 4.49 | |
| Merced | 182 | 2.27 | 4.14 | 2.38 | 0.03 | 2.26 | 0 | 0 | 0 | 0.07 | 11.15 |
| Annual Ave. | 2.6 | 2.36 | 2.09 | 0.94 | 0.55 | 0.08 | 0 | 0.04 | 0.16 | 8.82 | |
| Delano | 148 | 1.12 | 0 | 2.11 | 0.11 | 1.85 | 0 | 0 | 0 | 0 | 5.19 |
| Annual Ave. | 1.3 | 1.3 | 1.42 | 0.67 | 0.2 | 0.12 | 0 | 0.04 | 0.08 | 5.13 | |
| Porterville | 169 | 1.75 | 2.51 | 0.83 | 0.11 | 1.9 | 0 | 0 | 0 | 0.01 | 7.11 |
| Annual Ave. | 2.43 | 2.19 | 2.19 | 1.14 | 0.4 | 0.14 | 0.01 | 0 | 0.2 | 8.7 |