
Using Bud Dissection to Guide Winter Pruning Decisions
George Zhuang, UCCE Fresno County
Introduction
I recently completed bud dissections for the second annual bud fruitfulness survey of raisin and wine grape varieties in Fresno County. The survey aims to determine potential fruitfulness of dormant buds from the same vineyards in Parlier, Easton, and Kerman that were surveyed in 2014. With time, I hope to develop a useful relationship between potential bud fruitfulness and yield in these vineyards and, possibly, as a general indicator of potential grapevine productivity at other similar vineyards.

Figure 1. Cross section of a grape bud. The red arrow indicates the cluster primordia in the primary bud. This cluster primordia will develop into a grape cluster the next season.
For raisin type varieties, 50 canes were randomly selected in a vineyard. Buds from nodes 0 to 15 were selected from each cane. For spur-pruned wine grape varieties, 100 spurs with 2 nodes each were also randomly selected in each vineyard and dissected. Number of cluster primordia, from both primary and secondary buds, per node were counted separately under a microscope (Figure 1). To measure the actual fruitfulness, after budbreak in 2015 the same number of canes and spurs were randomly selected in the field and the number of clusters per node was counted. Both potential and actual bud fruitfulness data were averaged per node.
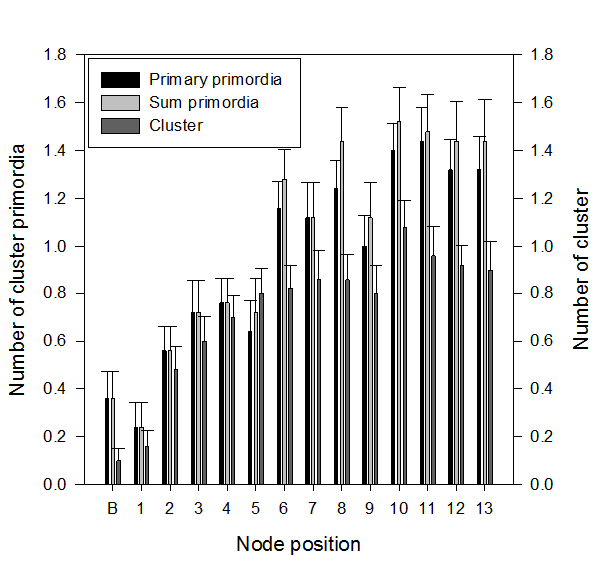
Figure 2. Comparison between the number of cluster primorida, representing potential fruitfulness, and the number of clusters, representing actual fruitfulness, in 2015, at different node positions in Selma Pete, Parlier, CA.
Results
Similar results were observed between potential and actual fruitfulness for both cane pruned and spur pruned varieties (Table 1 and Figure 2). Variation between potential and actual fruitfulness can be caused by secondary bud fruitfulness and low basal shoot emergence on canes. Potential bud fruitfulness data from bud dissection can be used to predict the actual bud fruitfulness and yield for next year (Table 1).
Utility
The usefulness of bud fruitfulness data increases with each year if the data is repeatedly collected from the same vineyard. For example, comparing next year’s data with the data from this year will provide some evidence to suggest yields might be similar,
higher, or lower, and this information can inform pruning decisions. Since the data can be collected at any time after harvest, the number of canes or spurs left during pruning can be adjusted based on the fruitfulness data. However, actual yield per vine can vary due to any changes of yield components. Sugar content at harvest is another important factor to determine the raisin yield. In addition, the accuracy of predicting the yield from bud fruitfulness data may vary depending on the site.
| Table 1. Potential (primary and secondary) and actual bud fruitfulness data of winegrapes in 2015 and 2016. | ||||
|---|---|---|---|---|
| 2015 | 2016 | |||
| Location | Variety | # primordia/node | # cluster/node | # primordia/node |
| Easton, CA | Cabernet Sauvignon | 2.03 | 1.99 | 1.90 |
| Kerman, CA | Cabernet Sauvignon | 1.60 | 1.32 | 1.61 |
| Kerman, CA | Chardonnay | 1.18 | 1.34 | 1.45 |
I would like to acknowledge support from the San Joaquin Valley grape growers that allowed me to sample their vineyards and technique guidance from Dr. Matthew Fidelibus, UCCE & UC Davis.